Got to take these one at a time...
Quote:
Originally Posted by Adak

BigV, thanks, and I know that some of those websites I linked to aren't the best for research, but others had the data in Excel spreadsheets and other formats, that I can't handle on this computer.
|
You're welcome. What I had in mind was this link:
I offer this constructive criticism of this link. It is just a picture. It has a title, but there's little there to go on, not a link back to the article, no legends on the axes, nothing. I did follow up on this picture's title, "Publicly held federal debt 1790-2009", and read some material though.
You say it is an picture of the problem with Socialism. That's not what I found.
Here's a link that has much more actual information than just that picture. It's a CBO report titled
The 2012 Long-Term Budget Outlook. Here's the money shot:
Let me break that down for you. First of
all, the graph, the report, nothing at all has anything at all to do with Socialism, or its supposed problems. I *suspect* that scare word came from some partisan bloviator who saw a report and then took the six or seven words in it that suited his panicky mood at the time, and mashed up that graph and slapped the label Socialism somewhere in the title of the blog post. I think you cribbed it from something like that.
Now that that is out of the way, let's talk about what the CBO is actually saying. They consider two scenarios, they call them extended baselines because they look at their projections for the budget for the next twenty-five or so years.
Quote:
|
Originally Posted by Congressional Budget Office
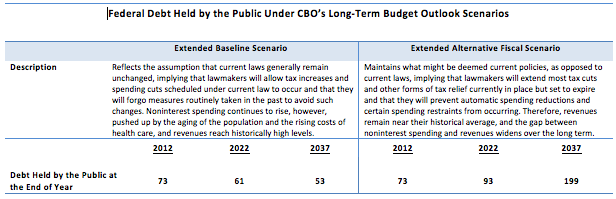
What Is the Budget Outlook Under the Extended Baseline Scenario?
Under the extended baseline scenario, which generally adheres closely to current law, federal debt would gradually decline over the next 25 yearsfrom an estimated 73 percent of GDP this year to 61 percent by 2022 and 53 percent by 2037. That outcome would be the result of two key sets of policy assumptions:
Under current law, revenues would rise steadily relative to GDP because of the scheduled expiration of cuts in individual income taxes enacted since 2001 and most recently extended in 2010, the growing reach of the alternative minimum tax (AMT), the tax provisions of the Affordable Care Act, the way in which the tax system interacts with economic growth, demographic trends, and other factors; revenues would reach 24 percent of GDP by 2037much higher than has typically been seen in recent decadesand would grow to larger percentages thereafter.
At the same time, under this scenario, government spending on everything other than the major health care programs, Social Security, and interestactivities such as national defense and a wide variety of domestic programswould decline to the lowest percentage of GDP since before World War II.
That significant increase in revenues and decrease in the relative magnitude of other spending would more than offset the rise in spending on health care programs and Social Security.
|
******
Quote:
What is the Outlook Under the Extended Alternative Fiscal Scenario?
The budget outlook is much bleaker under the extended alternative fiscal scenario, which maintains what some analysts might consider current policies, as opposed to current laws. Federal debt would grow rapidly from its already high level, exceeding 90 percent of GDP in 2022. After that, the growing imbalance between revenues and spending, combined with spiraling interest payments, would swiftly push debt to higher and higher levels. Debt as a share of GDP would exceed its historical peak of 109 percent by 2026, and it would approach 200 percent in 2037.
The changes under this scenario would result in much lower revenues than would occur under the extended baseline scenario because almost all expiring tax provisions are assumed to be extended through 2022 (with the exception of the current reduction in the payroll tax rate for Social Security). After 2022, revenues under this scenario are assumed to remain at their 2022 level of 18.5 percent of GDP, just above the average of the past 40 years.
Outlays would be much higher than under the other scenario. This scenario incorporates assumptions that through 2022, lawmakers will act to prevent Medicares payment rates for physicians from declining ***; that after 2022, lawmakers will not allow various restraints on the growth of Medicare costs and health insurance subsidies to exert their full effect; and that the automatic reductions in spending required by the Budget Control Act of 2011 will not occur (although the original caps on discretionary appropriations in that law are assumed to remain in place). Finally, under this scenario, federal spending as a percentage of GDP for activities other than Social Security, the major health care programs, and interest payments is assumed to return to its average level during the past two decades, rather than fall significantly below that level, as it does under the extended baseline scenario.
|
*** the kind of reductions in payments to providers that comprise the hotly debated $176 billion dollars "stolen" from Medicare, according to Ryan/Romney.
So, you say that the problem with Socialism is ... something, but you point at the "extended
alternative baseline scenario" as the scary bogeyman. It IS scary I agree. But if you read the CBO's own words, that scary prospect is what they project will happen if the tax cuts are permitted to stay in place.
...
Come on, Adak. This is Socialism? If you want to AVOID the "Socialist" outcome, fine--just keep extending the temporary Bush era tax cuts. This is what Comrade Romney has proposed, hasn't he? He won't increase anyone's taxes. "Absolutely." that was his *exact* statement on the issue, right? Socialist bastard. In fact, if you listen to him further, he says he will LOWER THE RATES. REALLY???? That scary graph was scary because the rates only stay the same, imagine how much faster and higher the Taxapolyse will hit if the rates are lowered? Oh, sure, Romney's gonna pay for them by eliminating funding for Big Bird and some other hand waving, but even taking him at his word, he's only aiming to make the changes "revenue neutral". He doesn't want to bring any more revenue to the Federal system. All cuts. No revenue increases.
You read the report. You look at the graphs. You listen to Romney's words. Then you come back and tell me which scenario his plan would take us to. And be prepared to substitute some numbers for his pitiful and unconvincing hand waving. You've shown your willingness and ability to support your statements to a degree far exceeding Romney's. Go on, convince me. I might vote for you.