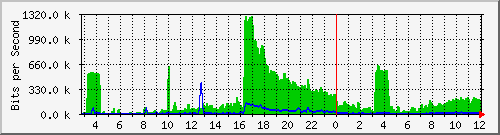
The above graph is called MRTG (for "Multi Router Traffic Grapher"). Internet traffic for my connection is watched at a very low level, statistics are built, and then graphed. This is only one of the graphs that I watch to see what traffic is like on my network. This graph covers the last 34 hours. The green is "outgoing" traffic, the blue line is "incoming". roughly speaking, visits to the Cellar and all the web sites that I host are represented by the green.
As you know, last week I submitted the thread containing the afghani crater image (and the flying redneck belly flop image) to fark.com and they picked it up and linked to it. The fark.com thread that discussed the thread also linked to the two images on the cellar.org server. That was when the "most users ever" number jumped from 43 to over 800...
The linkage happened just after 4pm and I immediately noticed a huge spike in traffic on the server, and got a few errors back from the forum software which indicated that it had suddenly become too busy to do almost anything else.
As you can see, "normal" traffic is fairly low. Low enough, in fact, that it looks like a 128k connection could handle most of it. The 3am spikes represent a backup routine run by another client of mine.
But you get a larger circuit because you need to be able to handle spikes like the fark.com spike. Another website on my network caused a similar jump one day by linking to an mp3 (yes, a legal one) and sending out an email telling people to download it.
This graph is also guaranteed to be inaccurate. The graph points are not actual transfer rates, but transfer rate AVERAGES over 5-minute periods. So there were certainly times at the peak when the circuit was "full". The maximum transfer is not the top point on the graph but slightly higher (it should be 1550). The fact that it never reached that point is probably good. In this particular case, the server (a P3-500) slowed down considerably before the transfer reached its peak. That's bad, but these days a more powerful server would be relatively cheap, and there are innovative ways to manage traffic on busy sites.
This graph also shows how fark.com linkage generates traffic. We can guess that many many fark.com readers watch fark for new links on a regular basis. A new link generates a lot of traffic for the first two hours or so, then it settles down in a rather organic fashion.
I use this as the IotD today because people may find it interesting and educational.